Creating an image via spectral scans
By Lionel Mulato
Lionel Mulato is an astrophotographer and spectroscopist, his observatory is based near Avignon. He studied physics at university and has been practicing astronomy as an amateur for many years. He discovered several Planetary Nebulae and participates in the spectral confirmation of these objects. Its spectra feed the professional HASH PN database. Lionel is a member of the 2SPOT association whose goal is to set up a remotely controllable telescope in Chile dedicated to spectroscopic observations.
It is possible to create line flux maps (2D images) of an object by scanning it with a spectroscope. Christian Buil described the method on his page and thanks to his ISIS software, amateurs are able to achieve such images.
Obtaining detailed flux maps requires meticulous work and many hours of installation. If done well these maps can be of great scientific interest. They give spatial information on the extinction, the ionization structure, the abundance of different chemical species, the temperature and the electronic density of a nebula …
To carry out a worthy diagnosis of plasmas constituting a nebula, a large diameter telescope and a medium or high resolution spectrograph are required. The diameter of amateur instruments (a few centimeters against a few meters for the pros) risks quickly limiting the possibilities of observations. Certain low intensity lines essential for the diagnosis of plasmas risk being for the most part inaccessible to amateurs.
This is my first attempt to create such maps. The observing conditions were not ideal, moon was almost full. I chose a really easy and well documented target : ngc 6720/M57, the ring nebula, to gauge the limits of my equipment and to familiarize myself with the method. It’s a very easy target, very bright. The results will then be compared with professional work to check whether the data acquired is relevant.
I present here my results and compare them to a professional study made in 1994 : http://articles.adsabs.harvard.edu/pdf/1994AJ….108.1860L
Equipment
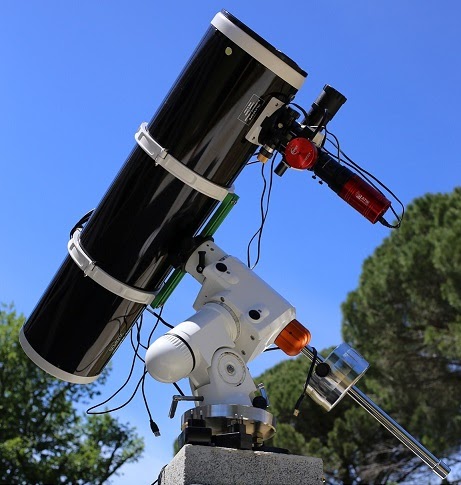
The equipment I used is a 0,2 m F/5 Newtonian Telescope, a low resolution Alpy600 spectroscope with a 23 µm slit (R=600) and a CCD camera Atik414 EX cooled at -10°C. The dispersion is ~0,3 nm/pixel at 656 nm.
Data acquisition
In the context of a first attempt, the slit has been moved across the nebula each 3 pixels. That is not a smooth scan. An unique 300s exposure spectrum has been taken for each slit position. This short unique exposure won’t help to get a good signal to noise ratio on faint line such as 4363 A or 5754 A. A total of 22 frames have been necessary to scan the nebula.
Data has been acquired on April the 5th 2020 from 02h00 UT to 04h00 UT.
All the raw frames have been bias, dark, flat corrected. The calibration of the instrumental response has been made on the A3V class star HD 174602 after acquisitions on NGC 6720.
A displacement of 2 pixels and the realization of several exposures for the same slit position would have been preferable in order to have a better spatial resolution and a better signal-to-noise ratio. But that would have quadrupled the exposure time. Here is the movement of the position of the slit during the acquisitions (exposures of one second on the autoguiding camera):
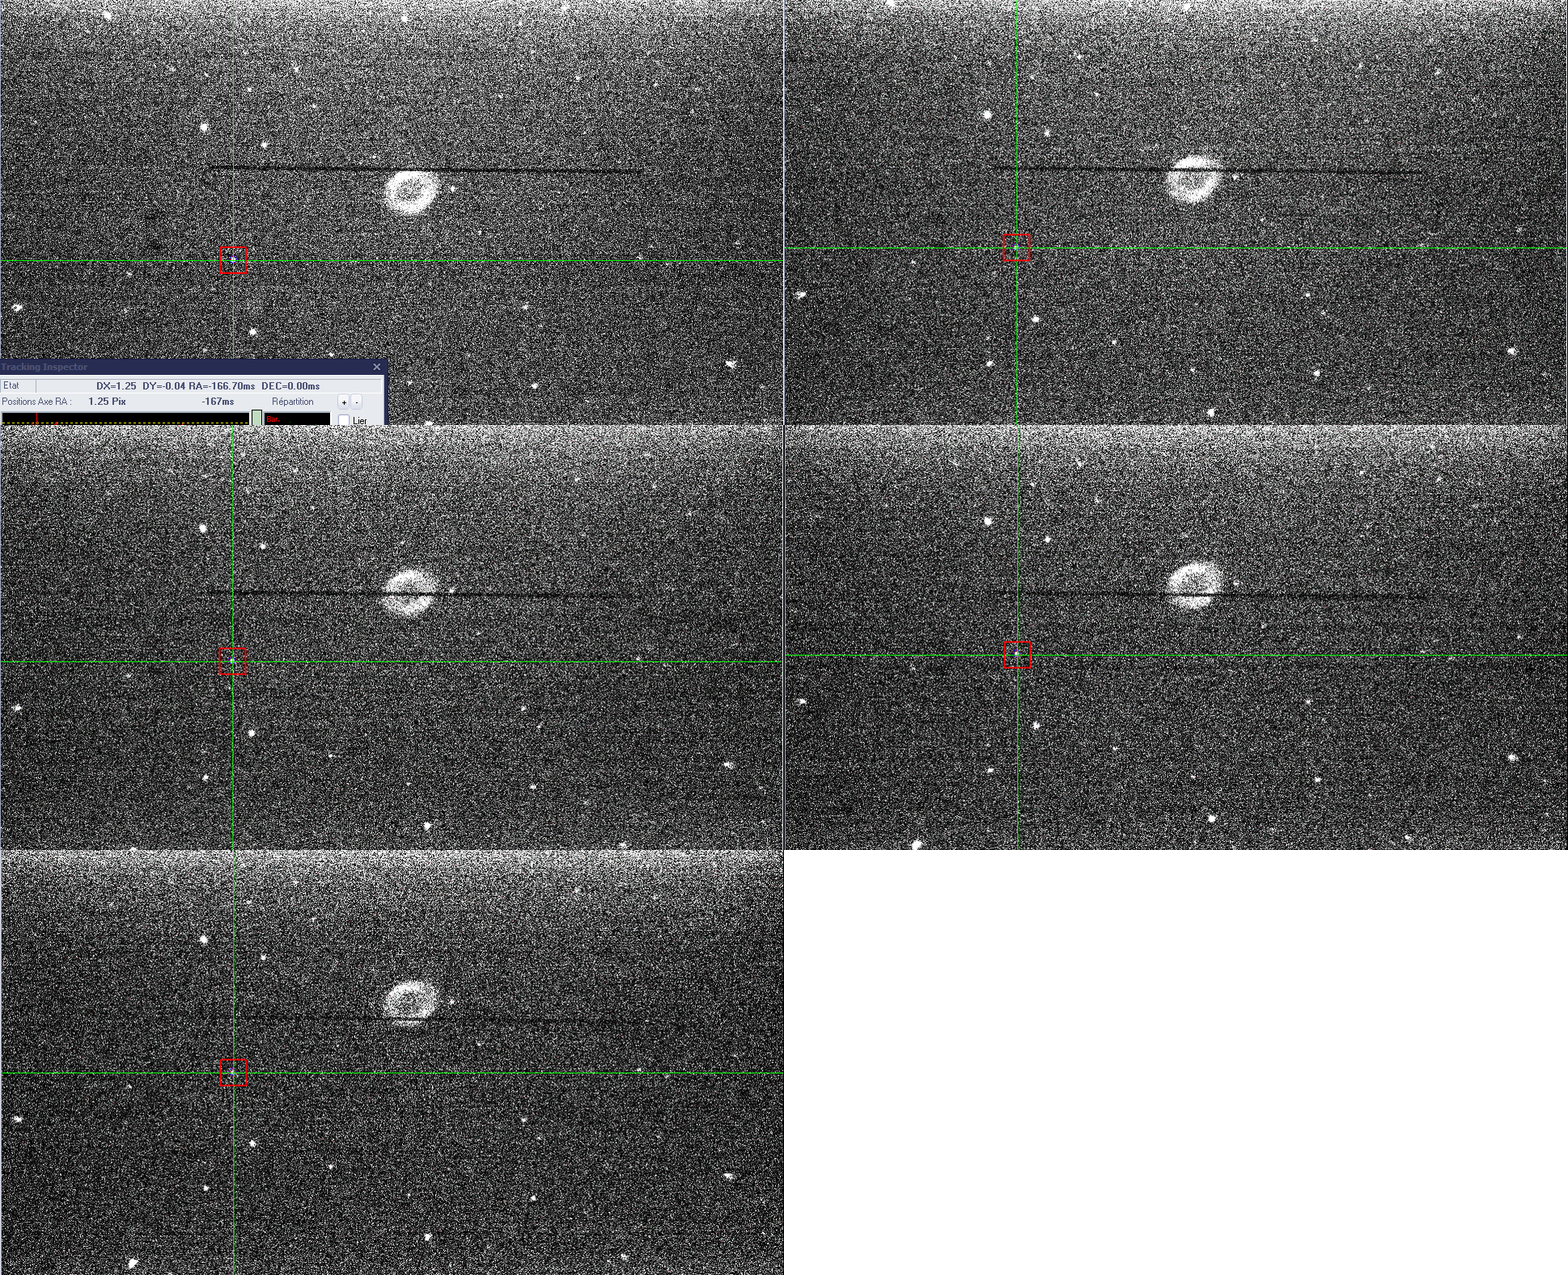
Slit moving across the PN (1s exposure time on autoguider camera)
2D and 1D processed spectrum
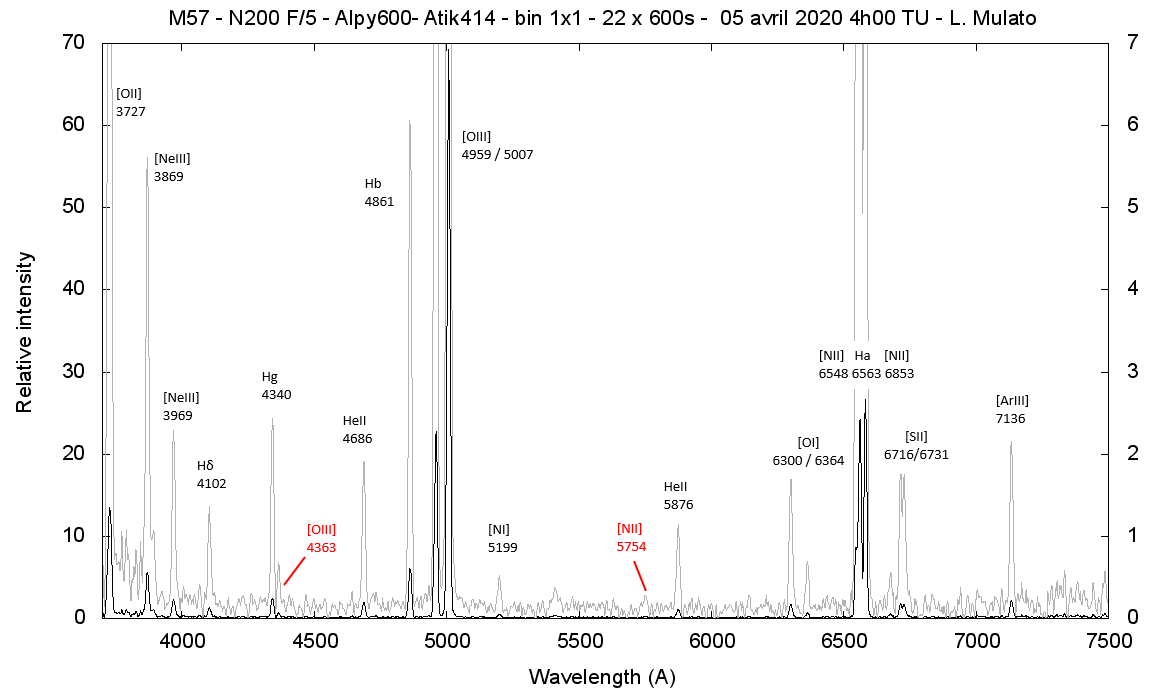
The spectrum shows many lines compared the dozens of PN candidates spectrum acquired for the past 2 years. That is appreciable. The lines [OIII]λ4363 and [NII]λ5754 are unfortunately very weak due to the short exposure time. [SII]λ6716 λ6731 lines and Ha [NII]λ6583 λ6548 are partially blended due to the low resolution of the spectroscope.
Alpy offers good detection in the UV, the lines of [OII] at 3727 A and [NeIII] at 3869 are perfectly detected. In red, I noted the 2 auroral lines of O2 + (4363 A) and N + (5754 A) ions. They are very weak but their measurement is however essential to determine the temperature of the plasmas. The Alpy low resolution does not make it possible to separate the lines of the [SII] at 6716 and 6731 Å properly, which poses a problem for establishing a proper diagnosis of the electronic density of the nebula. But I will come back to this later.

Lines flux map and color images
Thanks to Christian Buil’s ISIS software, it is possible to isolate each line and view its profile in 2D. Here are some images obtained for different emission lines. As in astrophotography, it is possible to combine the layers to reconstruct an RGB color image.

Visualisation [NII] Ha [OIII]
The 5 nm narrow band Ha filters conventionally used in astrophotography do not make it possible to differentiate the signal [NII] from the Ha signal. Thanks to the spectroscopy it is possible to isolate the 2 lines.

Visualisation [NII] Ha HeII
The HeII emission zone is clearly located in the center of the NP where the UV radiation from the central star will strongly ionize its near environment.

Visualisation HeII [NeIII] [NII]
The spectroscopy makes it possible to realize exotic combinations, inaccessible in amateur astrophotography by absence of narrow band filter of NeonIII, ArgonIII or Oxygen I or II for example.
Comparison with N.J. Lame et al. 1994
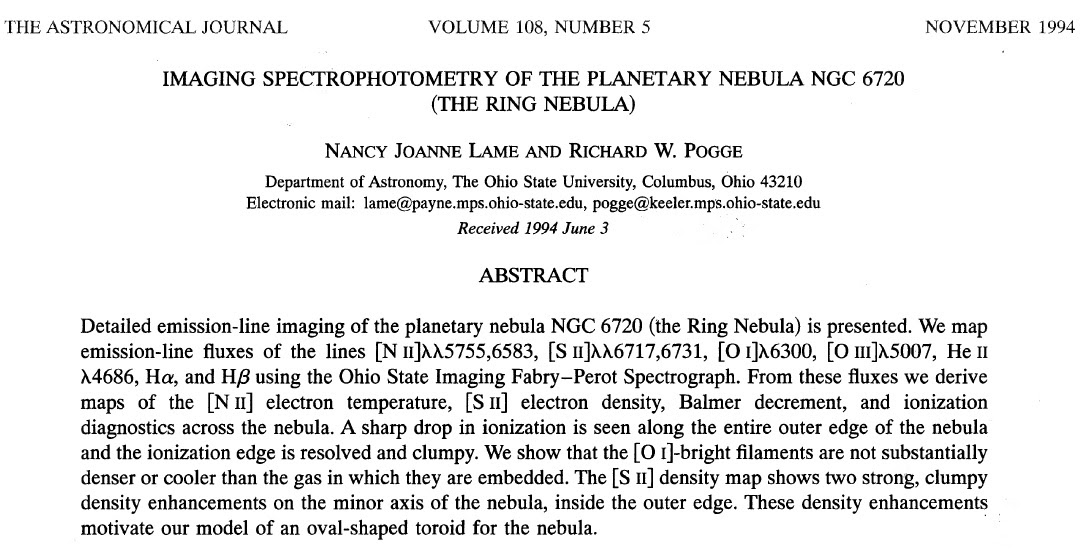
It’s time to compare these results to those of a publication from 1994: http://articles.adsabs.harvard.edu/pdf/1994AJ….108.1860L .The acquisitions were obtained using a spectro-imager and a 1.8 m diameter telescope. Even if the study is over 30 years old, we do not play in the same court at the material level.
Emission line flux map
Below are the maps obtained by N.J. Lame and R.W. Pogge for different wavelengths (top panels) and my results for the same wavelengths (bottom panel).
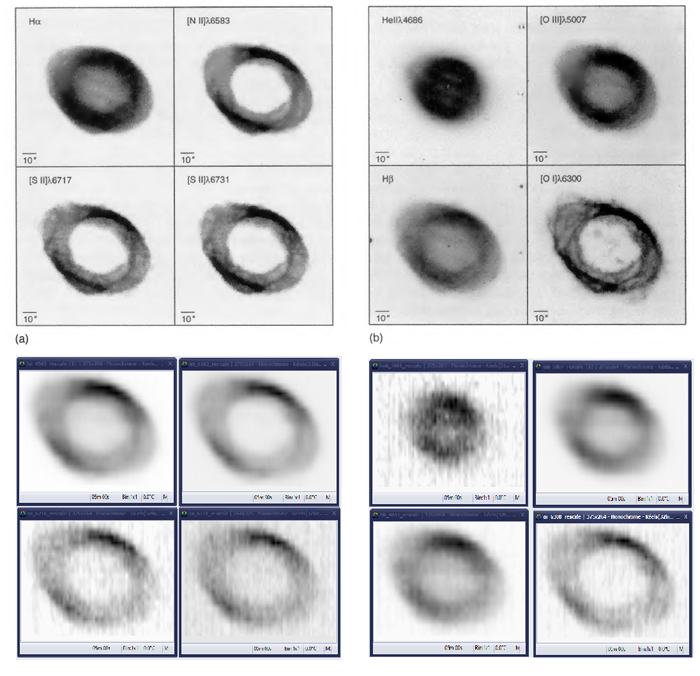
The emission maps are consistent. My results are much more noisy and less resolute given the less efficient equipment used and the low number and time exposures. We will now focus on the ratio of certain pairs of lines. Their report gives valuable information on the extinction, temperature, density of the nebula. To obtain correct results, the instrument response must be correctly calibrated (reference star used for calibration: HD 174602).
Balmer decrement
The ratio of the Ha / Hb lines gives the Balmer decrement, it provides information on the extinction of the nebula (its reddening). The ratio of these lines is constant and predicted by theory. In practice, this ratio often deviates from its theoretical value because of the dust located between the observer and the nebula. The blue part of the spectrum, in which the Hb line is located, undergoes greater attenuation than the red part (Ha). From the measured ratio it is possible to turn off the spectrum to restore the intensities that should have been observed in the absence of interstellar dust.
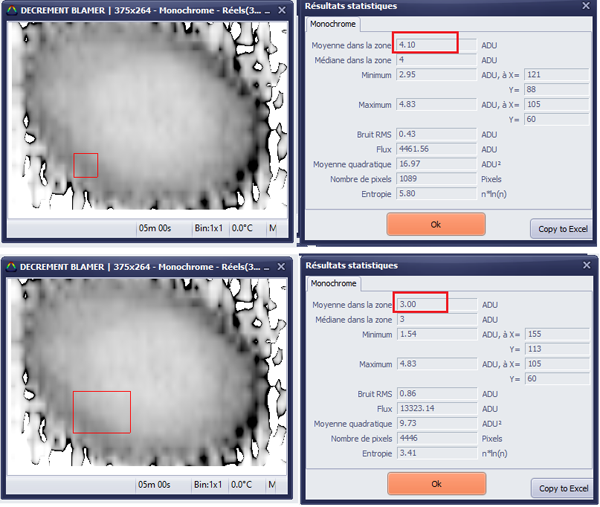
Here below on the left is the Balmer decrement that I obtained. On the right the map presented in the publication. My map does not offer a good resolution but gives information consistent with that of the publication. The most obscured areas are at the periphery of the nebula where the decrement is approximately equal to 4, and its mean value to 3. This is a very encouraging result which corroborates the data in the scientific literature.
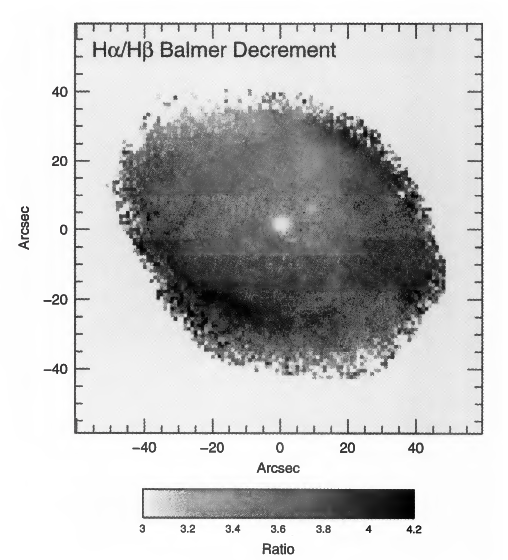
Map of the Balmer decrement obtained by N.J. Lame et al.
Electronic Density
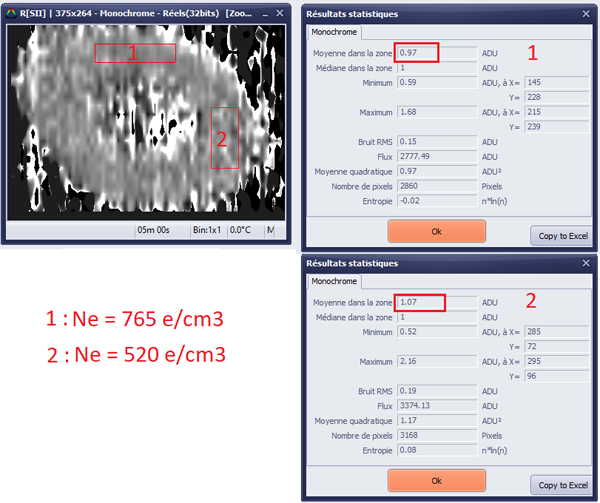
Now let’s look at the electronic density of the nebula. It is proportional to the ratio R [SII] of the lines of [SII] 6716 and 6731 A. The low resolution of the Alpy does not allow these 2 lines to be separated (see the 1D spectrum above). I got around this difficulty by scanning only the central part of the 2 lines, thinking that the ratio of the peak intensity of the lines should give a result similar to the ratio of their integral.
On the 1D spectrum presented above, the ratio of the 2 intensity peaks gives R [SII] = 1.06. By applying the Osterbrock relation below, we obtain for a temperature of 10,000 K an average electron density of 540 e / cm3. The result is quite consistent with that of the publication.

Here on the left is the electronic density map obtained, very noisy and not very resolved, and on the right the map presented in the publication. Measurements taken at various locations in the nebula still give results consistent with the publisher’s map … incredible given the poor quality of my map! It’s more of a fluke.
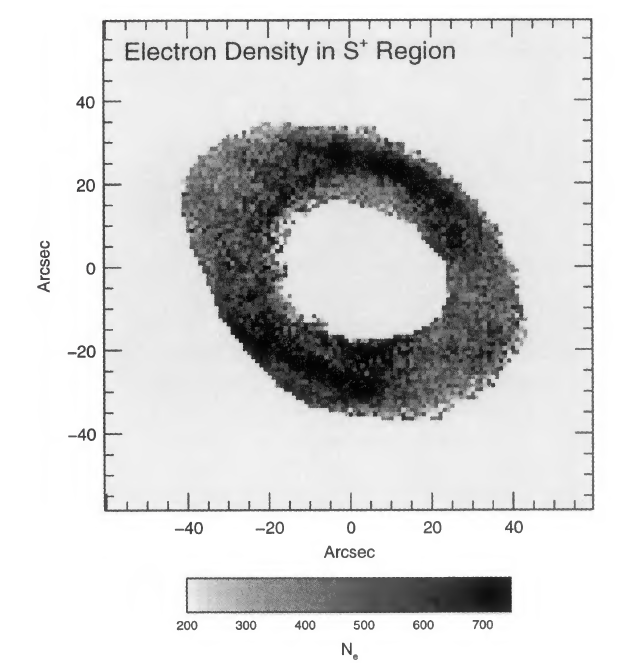
Electronic density map obtained by N.J. Lame et al
Ionisation structure map
Let’s continue with the ionization structure of the nebula.
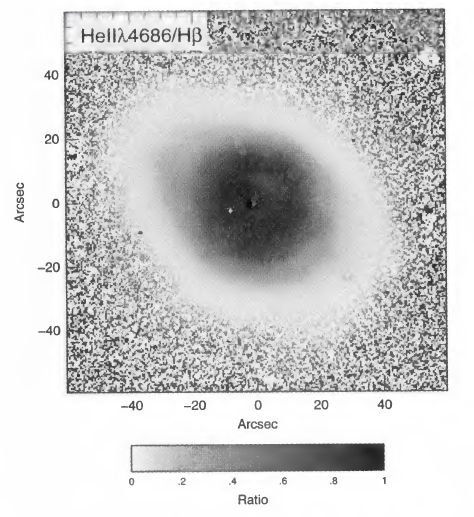
The maps obtained below on the left are all consistent with those of the publication, whether with regard to their spatial structure or at the level of the line intensity ratio. I should have corrected my maps by correcting the intensities of the lines thanks to the Balmer decrement obtained previously. The extinction of the nebula being low, the correction made would have been marginal. The results being moreover very noisy I did not embark on this instructive but time-consuming adventure.
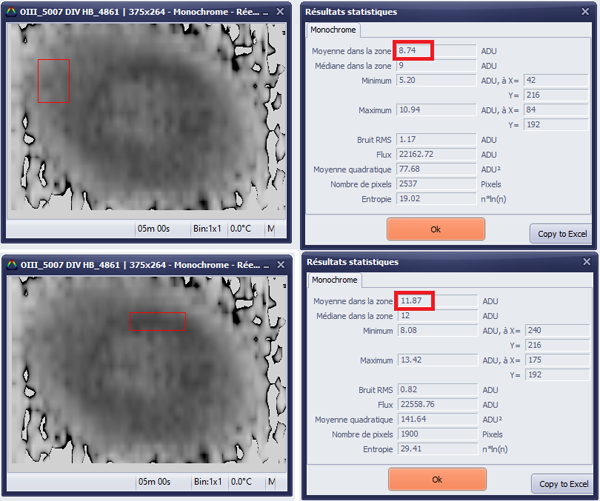
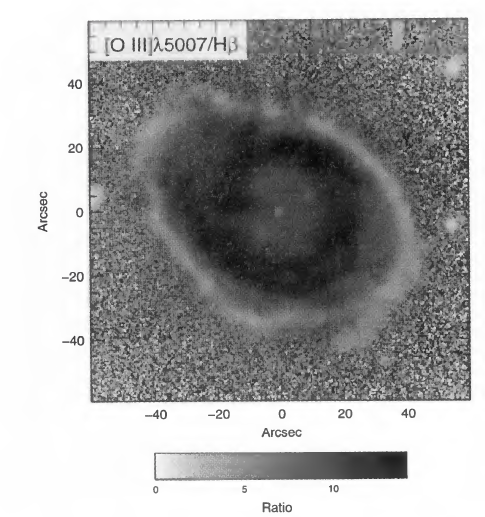
Ionization structure obtained by N.J. Lame et al
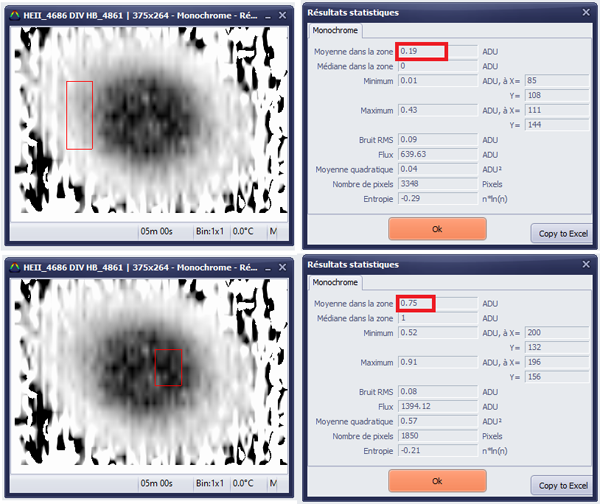
Ionization structure obtained by N.J. Lame et al
Electronic temperature
A part of the most interesting is the evaluation of the electronic temperature of nebulae. There are several line triplets for the same ion which make it possible to estimate this temperature. The most accessible for amateurs are the lines of the O2 + ion at 5007, 4959 and 4363 A and that of the N + ion at 6583, 6548, 5754 A. As specified on the 1D spectrum at the top of this page the lines 4363 and 5754 A are often very difficult for amateurs to detect.
In their publication, the researchers calculated the electron temperature in N + regions. I cannot perform this measurement because of the low resolution of the Alpy, the 3 lines Ha and N [II] at 6583 and 6548 A are not resolved and do not allow a clean measurement. The stingrays could have been separated, but I couldn’t have the courage to do so. The result would undoubtedly have been hazardous.
Here is the temperature map presented in the publication. The temperature is roughly homogeneous in the ring of the nebula, averaging 9600 K. (N + electronic temperature map obtained by N.J. Lame et al.)

On the other hand, I was able to evaluate the temperature of the electrons of the O2 + regions which according to the publication is supposed to be a little higher than that of N +, and of the order of 11,000K. The intensity ratio R [OIII] = I5007 + I4959 / I4363 is proportional to the temperature. Osterbrock gives the following relation to calculate it:

From the ratio of the intensity peaks of the 1D spectrum I obtain a temperature of ~ 11,500 K. The result is not aberrant, may be a little high compared to the values mentioned in the publication (~ 11,000 K) , but the order of magnitude is there. Correcting the extinction would have led to a slightly higher temperature (maybe a hundred Kelvin)
Below the temperature map [OIII] (in reality this is the R [OIII] ratio), the bad signal to noise ratio of the 4363 A line induces a very noisy and unreliable temperature map. But there is a similar temperature homogeneity throughout the ring. The average R [OIII] ratio of the area framed in red is 114 or 12,300 K. The result is not too far from that of O’Dell et al 2013 (10,000 – 11,700 K).
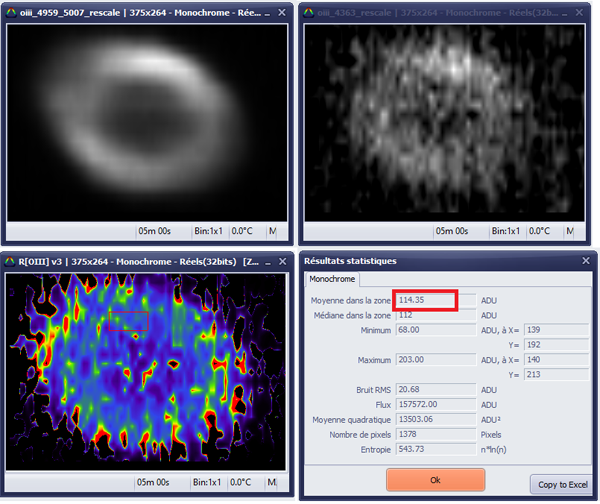
From left to right: Map [OIII] 50007 + 4959; Map [OIII] 4363; R card [OIII]; R [OIII] measured
Conclusion
I wasn’t expecting much of this first attempt to create an image of NGC 6720 via spectral scans. But I’m quite impressed of the result. In less than 2 hours exposure time and a rough scan, the order of magnitude of the main physical characteristics of the nebula have been assessed successfully.
Additional attempts on well studied PNe will be undertaken with a smoother scanning and multiple raw frames. A total time exposure of 15 h will be a minimum for a PN such as NGC 6720. This should improve slightly the spatial resolution and noticeably the S/N ratio of weak lines. Low aperture telescopes will prevent amateurs from acquiring high quality maps. But I hope we can provide to professionals good first estimations on bright and yet understudied nebulae.

